Developing countries lose $7.8 trillion to illicit financial flows in ten years – GFI
 As global volumes of illicit financial flows (IFFs) reach $1.1 trillion in 2013, the developing world lost $7.8 trillion between 2004 and 2013, the last year for which data are available, a new report released this week by Global Financial Integrity (GFI), a Washington DC-based research and advisory organization says.
According to GFI it measures illicit financial outflows using two sources: 1) deliberate trade misinvoicing (gross excluding reversals or GER) and 2) leakages in the balance of payments (hot money narrow or HMN).
“Trade misinvoicing is the primary measurable means for shifting funds out of developing countries illicitly.
Over the ten-year time period of this study, an average of 83.4 per cent of illicit financial outflows were due to the fraudulent misinvoicing of trade,” it says.
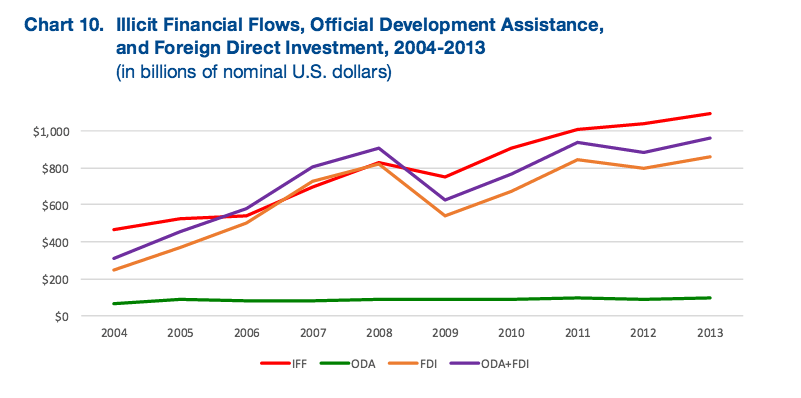
The report also compared IFFs to official development assistance (ODA) and foreign direct investment (FDI) and found that IFFs have exceeded those measures—combined—for seven of the ten years of the study.
“Despite these substantial recorded inflows, the continued growth of unrecorded, illicit outflows has a pernicious impact on development aspirations in many countries. For example: for every dollar of ODA that entered the developing world in 2012, ten dollars flowed out illicitly,” it adds.
The report discovered that taken together, growth of ODA and FDI (6.8 per cent a year) just barely outpaced the change in IFFs (6.5 per cent a year) between 2004 and 2013. Most of that growth came from increased FDI, as ODA to developing countries has stagnated over the period.
According to the report, while $1.1 trillion flowed illicitly out of developing countries in 2013, those countries received $99.3 billion in ODA. For every development-targeted dollar entering the developing world in 2013, over $10 exited illicitly.
 “This has held true since 2010, underscoring the fact that illicit financial outflows remain central to the development equation.
Effective domestic resource mobilization depends on their curtailment,” it says.
The report found that sub-Sahara Africa is the hardest hit region suffering the largest illicit financial outflows—averaging 6.1 per cent of GDP.
The study by GFI Chief Economist, Dev Kar and GFI Junior Economist, Joseph Spanjers analyzed discrepancies in balance of payments data and direction of trade statistics (DOTS), as reported to the IMF, in order to detect flows of capital that are illegally earned, transferred, and/or utilized.
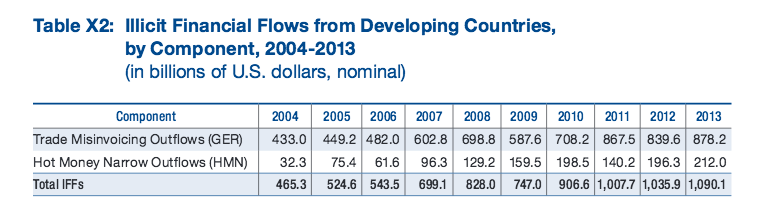 The study titled, “Illicit Financial Flows from Developing Countries: 2004-2013″ found that illicit financial flows first surpassed $1 trillion in 2011, and have grown to $1.1 trillion in 2013—marking a dramatic increase from 2004, when illicit outflows totaled just $465.3 billion.
Commenting on the findings of the report, Raymond Baker, GFI President said, “this study clearly demonstrates that illicit financial flows are the most damaging economic problem faced by the world’s developing and emerging economies.”
In a ranking of 20 countries by the volume of illicit outflows, China leads the table as the biggest exporter of illicit flows over the decade. China exported an average $139.23 billion and a cumulative $1.39 trillion.
South Africa, one of the only two African countries on the ranking, places seventh with an average of $20.92 billion and cumulative of $209.22 billion, while the other country, Nigeria is ranked 10th with an average of $17.80 billion and $178.04 billion cumulative.
By Emmanuel K. Dogbevi
Copyright © 2015 by Creative Imaginations Publicity
All rights reserved. This piece or any portion thereof may not be reproduced or used in any manner whatsoever without the express written permission of the publisher except for the use of brief quotations in reviews.